
|
Navigation from your Home screen:
 > operations
  or Performance
Your employee role must have the View Dashboard, Operations, and Performance permissions to view operations and performance information. See "Roles & Permissions" for more information.
On the Search Open tab on the Home page, access all appointment, agreement, and fleet statistics for your current location (selected at the top of TSD DEALER) in one place, for easy viewing.
You can also switch to any of the other tabs to view information that applies to that tab. For more information on individual customer, appointment, agreement, and fleet operations and performance dashboards:
- see "Appointment Operations and Performance"
- see "Agreement Operations and Performance Dashboard"
- see "Fleet Operations & Performance Dashboards"
To view a tutorial for this topic from the web application, click the Tutorials icon ( ), or to view a list of available tutorials.
Operations Dashboard
Note: Your Operations data may be shown by default, based on the Display Dashboard management setting
Click Operations  to view a breakdown of statuses for your appointments, agreements, and fleet, as well as customer and fleet imports.
Click to load the current, most up-to-date information. For status breakdowns, click a status tile to view a list of applicable records.
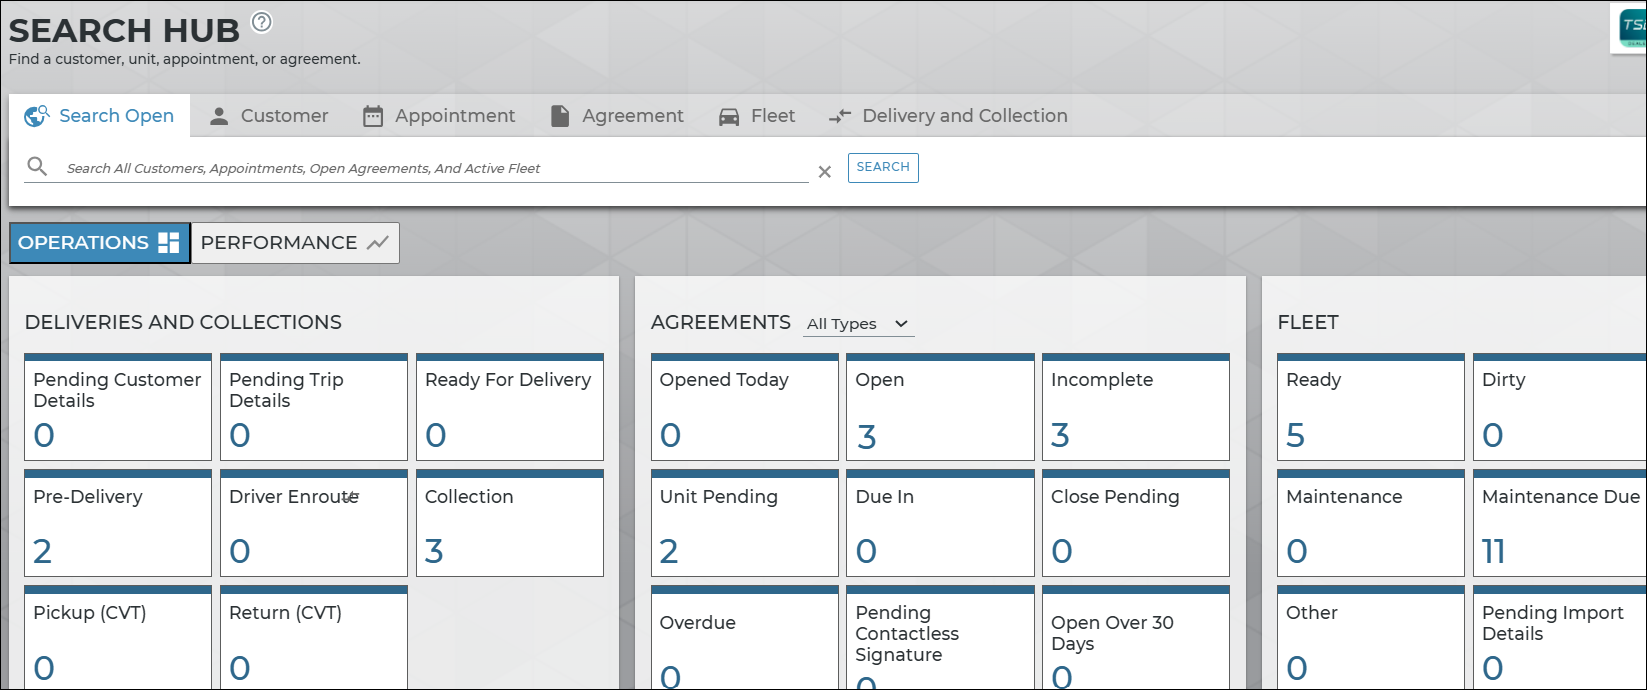
Hover to view the full-sized image.
Performance Dashboard
Click Performance  to view performance information from the first of the month to today, or another specified date range.
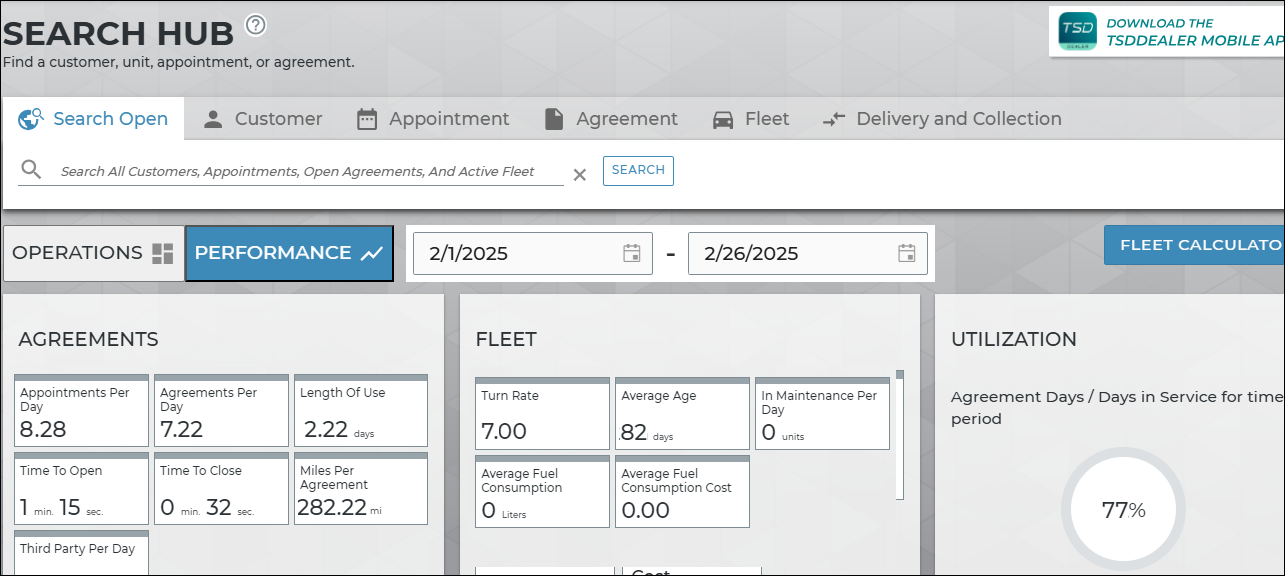
Hover to view the full-sized image.
Glossary of terms
Appointments Per Day
On your Appointments and Agreements Performance dashboards, this is the average number of new appointments created (booked) each day during your selected reporting period (30, 60, 90, or 120 days).
Agreements Per Day
On your Agreements Performance dashboard, this is the average number of new agreements created (opened) per day during your selected reporting period (30, 60, 90, or 120 days). Internal Use agreements are not included in this metric.
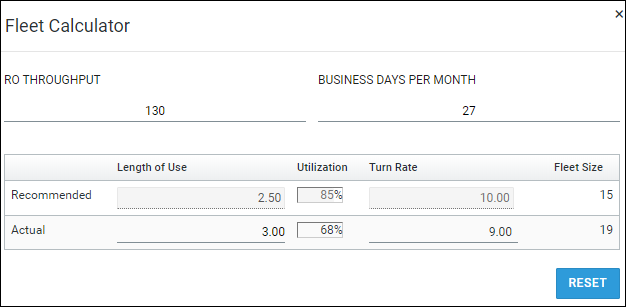
Fleet Calculator
Use the tool on the Fleet Performance dashboard to create different “what-if” scenarios by changing your Length of Use (LOU), Utilization percentage, and Turn Rate values for your monthly RO Throughput (repair orders completed per month).
As a result, the Fleet Calculator shows you the required fleet size for the values you have entered, as well as recommended values for the industry.
Use this information to make business decisions that aim for a lower LOU and a higher utilization percentage so you can write more ROs and ultimately bring in more revenue.
Hover to view the full-sized image.
Example: Let's say, with 26 business days per month and 65 units in your fleet, you write about 615 ROs, and your LOU is 2.75. This means your Turn Rate is 9.45; (26 business days ÷ 2.75 LOU); in other words, you can use each unit in your fleet on an agreement 9.45 times per month. But what if you cut down your LOU to 2.50? Your Turn Rate increases to 10.40 and your monthly ROs can increase to 676 with the same fleet size (10.40 Turn Rate x 65 Fleet Size). That's an additional two (2) ROs per day, 61 ROs per month, and 732 ROs per year with the same fleet! See "Best Practices: Length of Use (LOU)" for tips on managing your LOU.
- Enter your RO Throughput, or the average number of repair orders (ROs) you write in a month. To get an idea of what this number may be, try taking the Agreements Per Day metric on your Agreement Performance dashboard (for 90-day performance) and multiplying it by your number of business days in a month.
- Enter your business days per month, if different from the default (the number of days in the current month except Sundays).
- Based on this information and your current fleet performance data over 90 days, the tool displays your actual metrics compared to recommended values for the industry. See "Understand the metrics: calculations and recommendations" in this topic for more information.
- To understand how these metrics can affect your fleet size, you can edit your actual LOU, Utilization, and Turn Rate values. (To reset all values back to their defaults, tap .)
| Metric | Calculation | Recommended Value (over 90 days) |
|---|---|---|
| Length of Use: Average length of agreements at the location over the last 90 days, from your Length of Use metric on your Agreement Performance dashboard (90-day performance). Read the full definition. | Number of days on closed agreements ÷ total closed agreements | 2.50 |
| Turn Rate: An estimated average number of times per month that you use each of your units. |
Business Days Per Month ÷ Length of Use | 10.00 |
| Utilization: Percentage of time that units have been in use over the last 90 days, from your Utilization on your Agreement Performance dashboard (90-day performance). Read the full definition. | Agreement Days ÷ unit Days in Service | 85% |
| Fleet Size: The number of units in your fleet. Read the full definition. | Dealer RO Throughput ÷ Turn Rate | Your RO Throughput ÷ Turn Rate |
Length of Use (LOU)
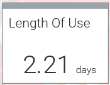
Length of Use (LOU) is the average length, in days (rounded to two decimal places), of agreements that were closed during a given period.
![]() Where can I find my location's LOU?
Where can I find my location's LOU?
How can I lower my LOU to the recommended value of 2.5 days (over 90 days)?![]()
Miles Per Agreement
On your Agreements Performance dashboard, this is the average number of miles accrued by units on agreements, during your selected reporting period (30, 60, 90, or 120 days). Internal Use agreements are not included in this metric.
Third Party Per Day
On your Agreements Performance dashboard, if your location uses a Third Party service, this is the average number of Third Party agreements, or agreements in which a unit is provided by a third party, created at the location per day, during your selected reporting period (30, 60, 90, or 120 days).
Time To Close
On your Agreements Performance dashboard, this is the average length of time (minutes and seconds) employees have spent closing an agreement during your selected reporting period (30, 60, 90, or 120 days). Internal Use agreements are not included in this metric.
Time To Open
On your Agreements Performance dashboard, this is the average length of time (minutes and seconds) employees have spent opening an agreement during your selected reporting period (30, 60, 90, or 120 days). Internal Use agreements are not included in this metric.
Toll Success
On your Search Open Performance Dashboard, locations using TSD Toll Connect with Verra Mobility can use the Toll Success section to track tolls that were charged successfully to either the customer or your location. Use this information to investigate low success rates and take action to avoid being billed for tolls due to errors in process and improve customer billing practices. See "Track Toll Success on the Performance Dashboard".
Total Opened
On your Agreements Performance dashboard, this is the total number of agreements opened at the location during your selected reporting period (30, 60, 90, or 120 days), separated into those opened on the web application and on the mobile app. Internal Use agreements are not included in this metric.
Total Closed
On your agreements performance dashboard, this is the total number of agreements closed at the location (excluding reopened and voided agreements), separated into agreements closed on the web application and on the mobile app. Internal Use agreements are not included in this metric.
Idle > X Days
This number of days [X] is based on the Units Idle (Days) management setting. It is set to 5, by default.
On your Fleet Operations dashboard, this metric shows the number of units that have been idle more than a certain number of days.
In Service > X Months
On your Fleet Operations dashboard, this metric shows the number of active units in your fleet that have been in service longer than a certain number of days, as determined by the Units In Service (Days) management setting.
Average Age
On your fleet performance dashboard, this is the average age of units in your fleet.
Maintenance Per Day
On your fleet performance dashboard, this is the average number of units you have in maintenance per day, based on the unit's status. In other words, this is the number of units currently in maintenance for your selected date range, divided by the number of days in your date range. See "Schedule maintenance intervals" for more information.
Utilization
Utilization is the percentage of time that units, excluding Shuttle units, have been in use during a given period.
Simply put, it is calculated by: Agreement Days ÷ In Service Days. This is the number of calendar days a unit was in use on agreements ÷ number of days the unit was in service, multiplying by 100 to arrive at a percentage.
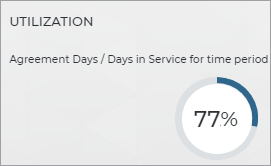
However, depending on your manufacturer, certain unit statuses and types of agreements may be excluded from utilization calculations.
Monitoring utilization on a weekly and monthly basis will help you determine your business's efficiency and properly rotate units to ensure proper fleet mix.
© 2026 TSD Rental, LLC